Example of data wrangling in R (part 1)
Load packages
library(readr)
library(dplyr)
library(ggplot2)
Load dataset
by_tag_year <- read_csv("by_tag_year.csv")Inspect dataset
head(by_tag_year)## # A tibble: 6 x 4
## year tag number year_total
## <dbl> <chr> <dbl> <dbl>
## 1 2008 .htaccess 54 58390
## 2 2008 .net 5910 58390
## 3 2008 .net-2.0 289 58390
## 4 2008 .net-3.5 319 58390
## 5 2008 .net-4.0 6 58390
## 6 2008 .net-assembly 3 58390Add fraction column
by_tag_year_fraction <- by_tag_year %>% mutate(fraction = number/year_total)Print the new table
head(by_tag_year_fraction)## # A tibble: 6 x 5
## year tag number year_total fraction
## <dbl> <chr> <dbl> <dbl> <dbl>
## 1 2008 .htaccess 54 58390 0.000925
## 2 2008 .net 5910 58390 0.101
## 3 2008 .net-2.0 289 58390 0.00495
## 4 2008 .net-3.5 319 58390 0.00546
## 5 2008 .net-4.0 6 58390 0.000103
## 6 2008 .net-assembly 3 58390 0.0000514Print the new table
head(r_over_time)## # A tibble: 6 x 5
## year tag number year_total fraction
## <dbl> <chr> <dbl> <dbl> <dbl>
## 1 2008 r 8 58390 0.000137
## 2 2009 r 524 343868 0.00152
## 3 2010 r 2270 694391 0.00327
## 4 2011 r 5845 1200551 0.00487
## 5 2012 r 12221 1645404 0.00743
## 6 2013 r 22329 2060473 0.0108Create a line plot of fraction over time
ggplot(r_over_time, aes(x=year, y=fraction))+
  geom_line()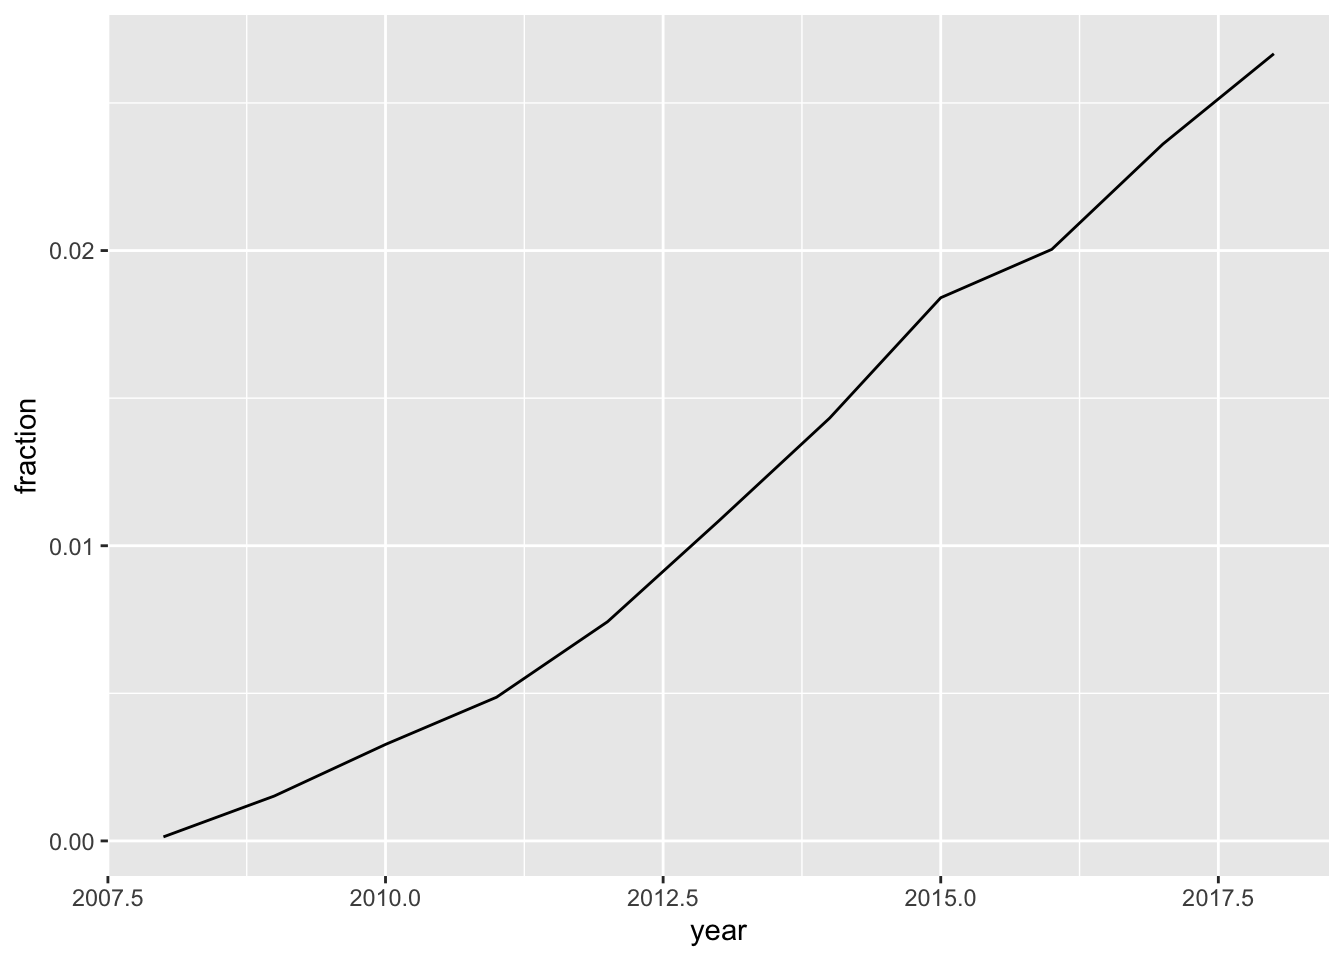
Plot tags over time on a line plot using color to represent tag
ggplot(selected_tags_over_time, aes(x=year, y= fraction, color=tag))+
  geom_line()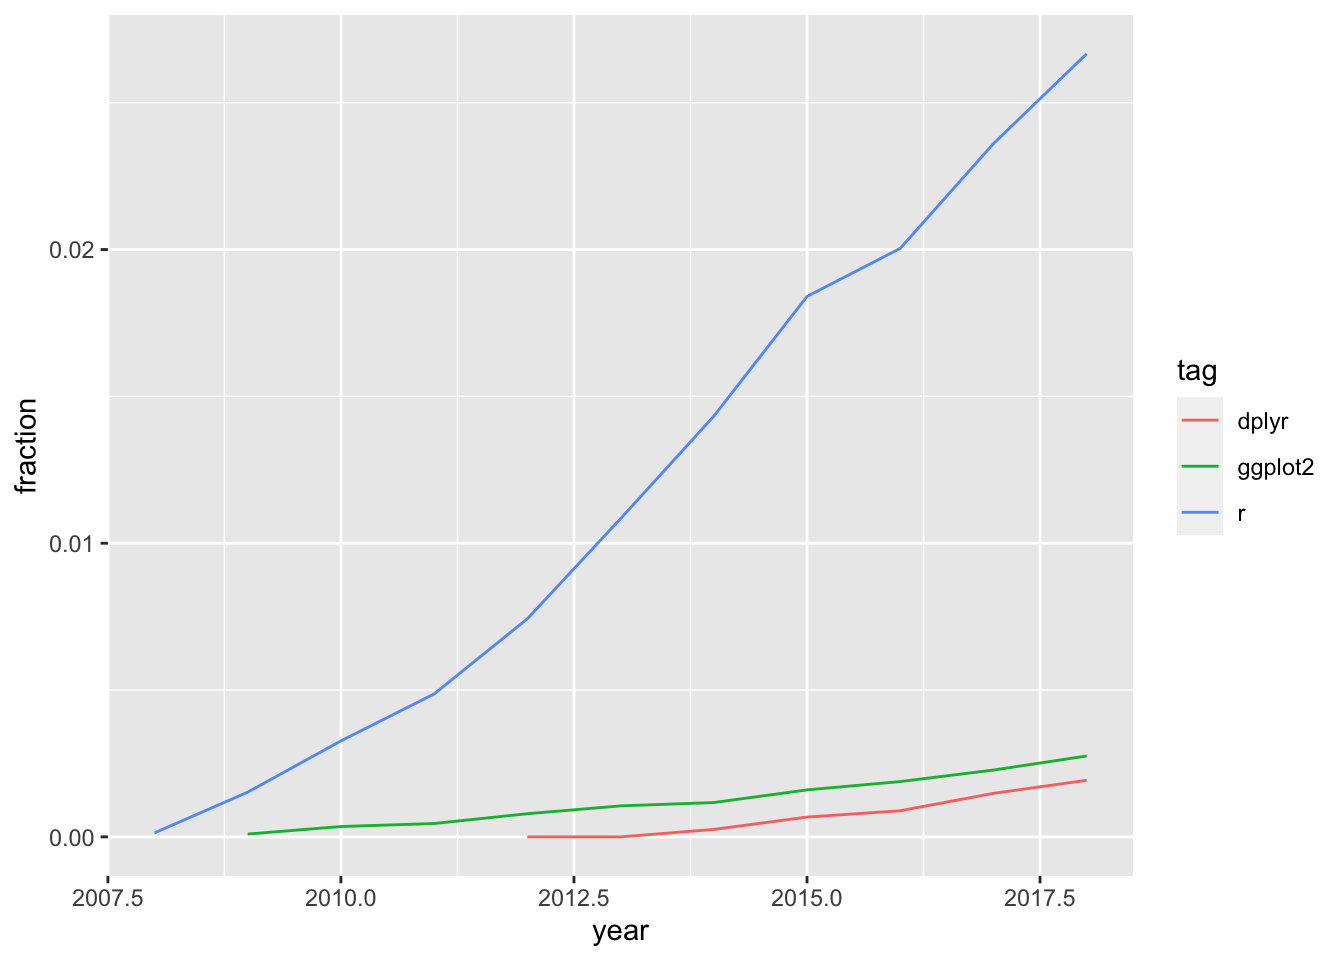
Find total number of questions for each tag
sorted_tags <- by_tag_year %>%
  group_by(tag)%>%
  summarise(tag_total = sum(number))%>%
  arrange(desc(tag_total))
## `summarise()` ungrouping output (override with `.groups` argument)Plot tags over time on a line plot using color to represent tag
ggplot(by_tag_subset, aes(x=year, y=fraction, color=tag))+
  geom_line()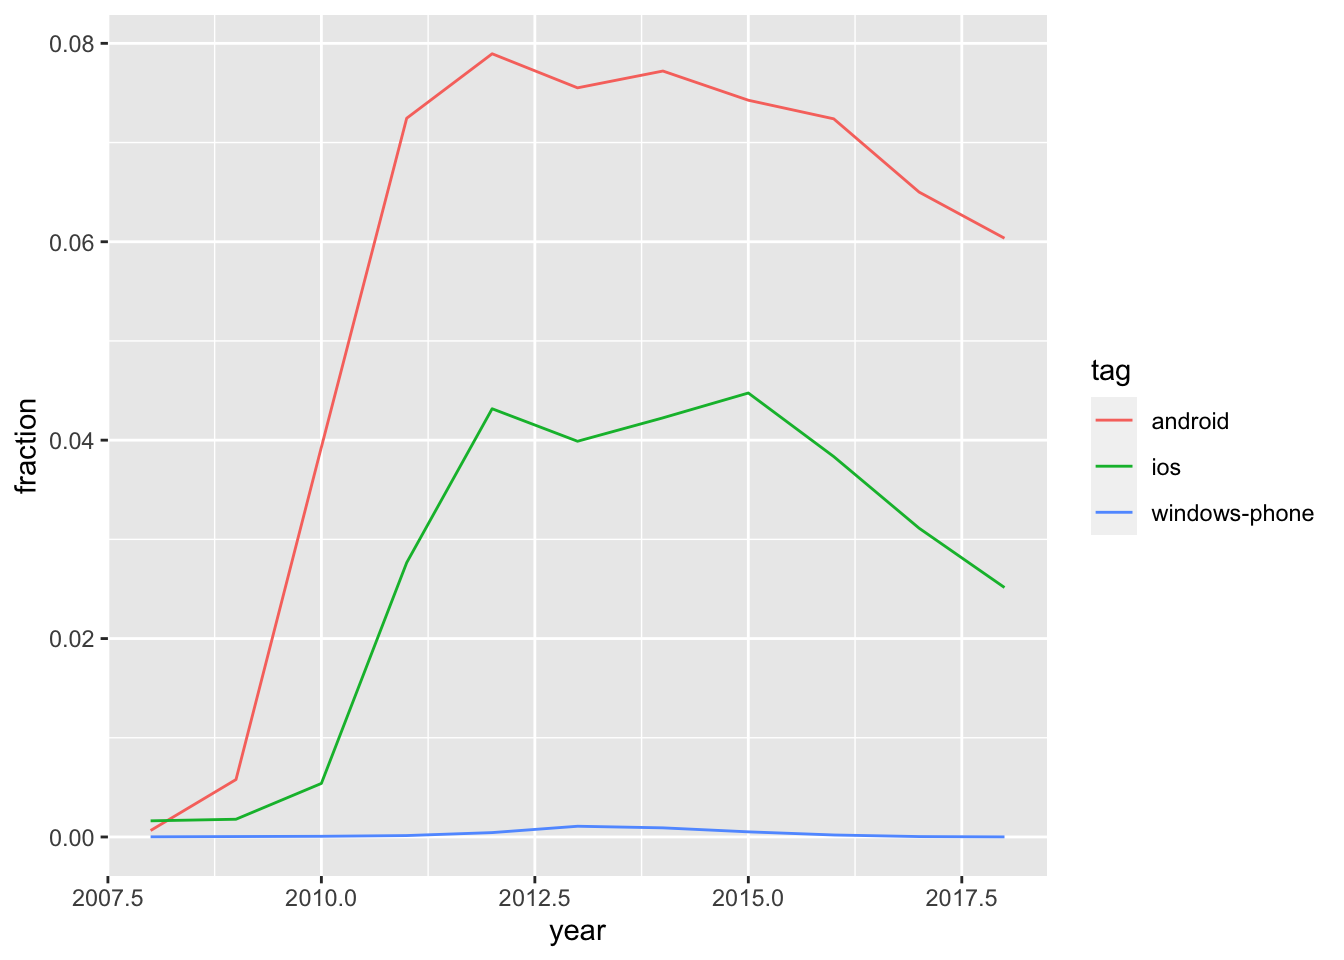
Amy Jones
My research interests include autism, psychosis and alexithymia. matter.